Designing models
Use the Axiom Model Designer to modify standard data models by adding measures and fields, as well as filtering out unwanted data to align with your specific needs. You can create new data models to bring together data in your Axiom system, including extendible data.
Within a model, the table list is displayed on the left. The table list includes a list of tables, but also their associated columns, folders, and measures. Clicking any of these opens the properties panel for that item to the right of the table list.
Creating new models
-
In the Intelligence Center, click the Models tab.
-
Click +Create.
-
Click Create model.
-
Click + Add table.
Adding tables to a model
You can add three types of tables to a model:
-
Axiom tables
-
Pivot tables
-
Measure tables
The table properties panel to the right displays table management information that is relevant to the specific table type.
-
In the Intelligence Center Models tab, click a model to open it.
-
Click + Add Table and select Add and Axiom table from the menu.
-
Click the drop-down and select an Axiom table to use as the data context for the new model table. The new model table contains fields from the selected table and related tables (if the related table is a dimension table).
NOTE: Only tables to which you have access are displayed in the drop-down.
-
Click Add table.
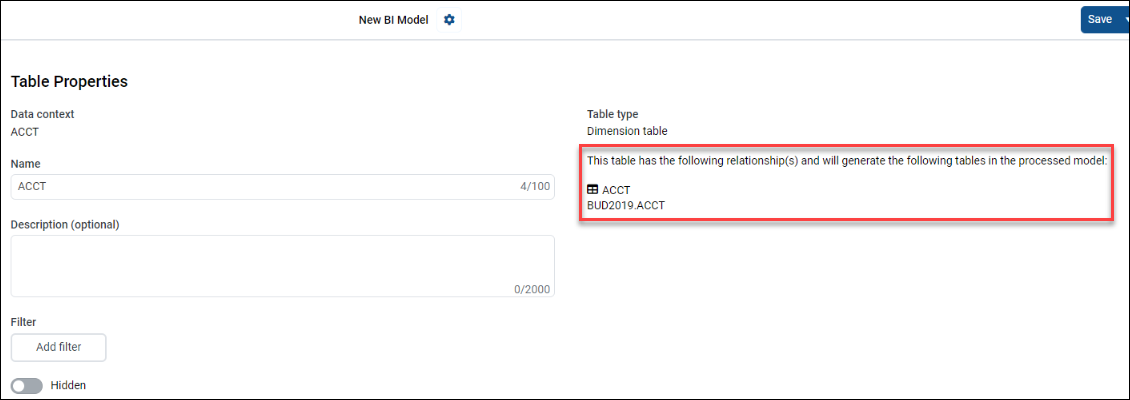
The Table Properties panel contains the following actionable fields:
| Field name | Description |
|---|---|
| Description | Type a description for your table in this text field. This field is optional (2000-character limit). |
| Filter | Click Add filter to create a filter for the table based on the data context table and any of its related tables. See Using the Filter Wizard more information. |
| Hidden | Click the Hidden toggle to hide the table when model definition is processed. The model is not visible in the visualization report. |
| Relationships | This field displays the table and column relationships, includings relationships to and from the table. This field is not editable, but reflects the relationships that were created by your selections. |
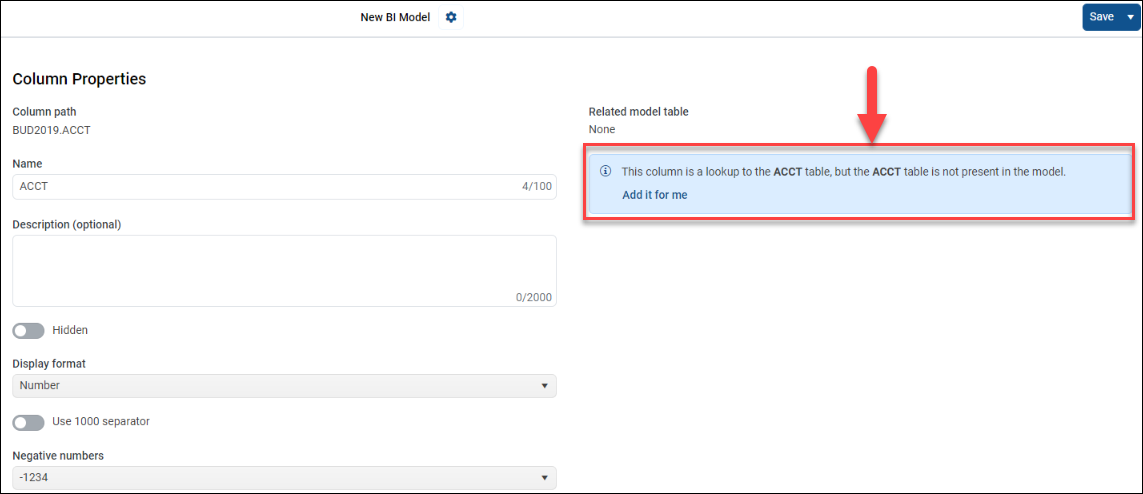
For fact tables that have look-up columns added to the table, the Column Properties panel presents an option to add a dimension table to the model.
For dimension tables, the Table Properties panel lists all tables with relationships to the dimension table and information as to which tables Axiom generates when the model is processed.
IMPORTANT: You must add table with a look up column to dimension tables for them to be included during processing. Dimension tables with no lookups pointing to the table will not be included during processing.
To add a pivot table:
-
In the Intelligence Center Models tab, click a model to open it.
-
Click + Add Table and select Add pivot table from the menu.
-
In the Add pivot table dialog, click a table or table series to serve as the data source for the new table.
-
Click Continue.
-
In the dialog, select a column sequence from the source table/series and the start year, including the number of years to include.
-
Click Complete.
The Table Properties panel contains the following actionable fields:
| Field name | Description |
|---|---|
| Description | Type a description for your table in this text field. This field is optional (2000-character limit). |
| Start year | Click the drop-down to select the start year for the time series. |
| # of years of data to include | Click the drop-down to select the number of years from the series to include in the table. The number of years includes the start year. |
| Hidden | Click the Hidden toggle to hide the table when model definition is processed. The model is not visible in the visualization report. |
| Relationships | This field displays the included table and column relationships. A date relationship is always displayed in the table properties for a pivot table, as Axiom creates a new date table (included in processing). This field is not editable, but reflects the relationships that were created by your selections. |
NOTE: You cannot add columns, measures, or folders to pivot tables.
A measure table is a placeholder table that acts as a standalone folder for your measures. You can create measures in this table as an alternative to placing measures on Axiom tables.
-
In the Intelligence Center Models tab, click a model to open it.
-
Click + Add Table and select Add measure table from the menu.
-
In the Create a measure table dialog, type a name for the table in the Name field.
-
Click Create table.
The Table Properties panel contains the following actionable fields:
| Field name | Description |
|---|---|
| Description | Type a description for your table in this text field. This field is optional (2000-character limit). |
| Hidden | Click the Hidden toggle to hide the table when model definition is processed. The model is visible in the visualization report. |
After you configure your measure table properties, you can add quick measures.
To add quick measures:
-
In the table list, click the ellipsis associated with a measure table.
-
Click Add quick measure.
-
In the Select a template dialog, click to a measure to select it.
-
Click Continue.
-
In the Create Measure dialog, type a name for your measure in the Name field. The rest of the fields vary based on the specific measure type that you selected. You can drag columns from the table list on the left into the parameter fields. You can only drag date columns into the Date parameter field.
-
Review the Formula preview area to verify that the intended formula is populated.
-
Click Create Measure.
-
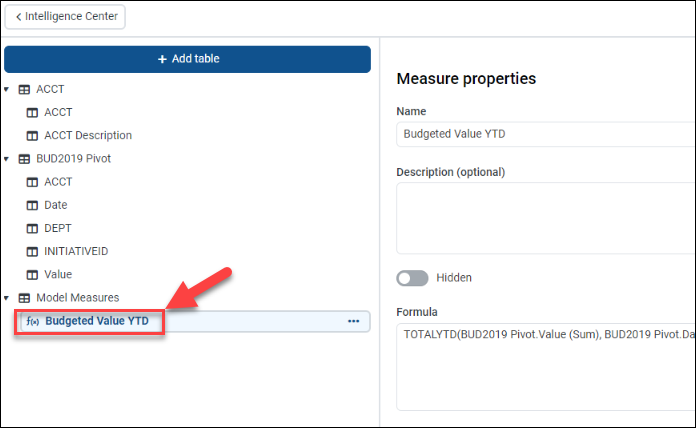
In the table list, click the measure formula to open the table properties and edit the display properties.
-
Click Save.
The Measure Properties panel contains the following actionable fields for the measure formula:
| Field name | Description |
|---|---|
| Description | Type a description for your table in this text field. This field is optional (2000-character limit). |
| Hidden | Click the Hidden toggle to hide the table when model definition is processed. The measure is not visible in the visualization report. |
| Formula | Displays the Data Analysis Expression (DAX) formula used for the measure. To modify the formula, click Edit, which opens the Create Measure dialog. |
| Display format | Click the drop-down to select the display format: Number, Currency, Percent, or Decimal. |
| Decimal places | Click the arrows to select the number of decimal places to use. For example, three decimal places is 1234.123. This option is not available for the Number format. |
| Use 1000 separator | Click the toggle to use a comma separator (,) for values of 1,000 and above. |
| Negative numbers | Click the drop-down to select a setting for negative numbers. The options include -1234 or (1234). |
The following table defines the available measure types:
| Measure | Measure category | Definition |
|---|---|---|
| Aggregated column | Aggregation | Calculate the aggregated value of a column. |
| Filtered value | Filtered values | Calculate a value with a filter applied. |
| Difference from filtered value | Filtered values | Calculate the difference between a value and its value with a filter applied. |
| Percentage difference from filtered value | Filtered values | Calculate the percentage difference between a value and its value with a filter applied. |
| Addition | Arithmetic | Calculate the sum of two values. |
| Subtraction | Arithmetic | Calculate the difference of two values. |
| Multiplication | Arithmetic | Calculate the product of two values. |
| Division | Arithmetic | Calculate the ratio of a value to another value. |
| Percentage difference | Arithmetic | Calculate the percentage difference between two values. |
| Year-to-date total | Time intelligence | Calculate the total of the base value, starting from the beginning of the current year. |
| Quarter-to-date total | Time intelligence | Calculate the total of the base value, starting from the beginning of the current quarter. |
| Month-to-date total | Time intelligence | Calculate the total of the base value, starting from the beginning of the current month. |
| Year-over-year change | Time intelligence | Calculate the year-over-year change of the base value. |
| Quarter-over-year change | Time intelligence | Calculate the quarter-over-quarter change of the base value. |
| Month-over-month change | Time intelligence | Calculate the month-over-month change of the base value. |
Adding columns to your model table
-
In the Intelligence Center Models tab, click a model to open it.
-
In the table list, click the Action menu (ellipsis icon).
-
Click Add columns.
-
In the Add columns menu, select the columns to add to the model. You can use the Search field at the top of the menu to search for specific columns.
-
Click Add to table.
-
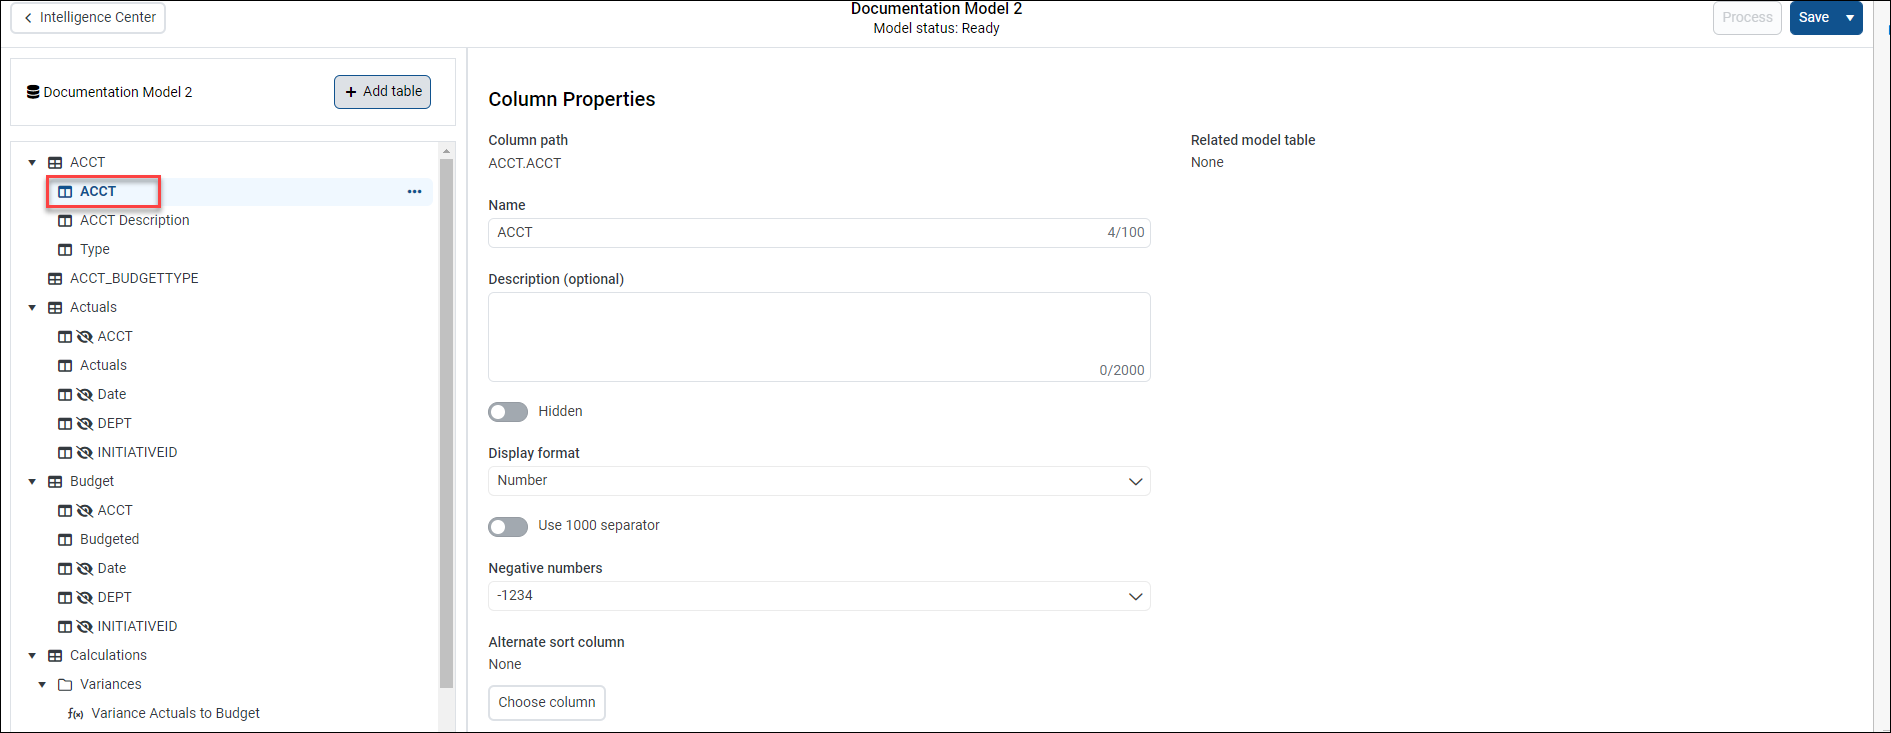
In the table list, click the column below the table to edit its properties.
Column properties relationship details are displayed if the column is a look-up column on a dimension table. If you add a look-up column to a fact table or large dimension table, but no dimension table was added to the model, you are prompted to add a dimension table here.
NOTE: You can only add columns from lookup dimension tables to a pivot table.
Using folders within a model
You can add folders to Axiom or measure tables and create subfolders within an existing folder.
Add a folder to a table:
-
In the Intelligence Center Models tab, click a model to open it.
-
In the table list, click the ellipsis to open the action menu.
-
Click Create folder.
-
In the Folder name field, type a name for the folder.
-
Click Create folder.
Use the action menuto add columns to the folder, create a new folder within that folder, move the folder, or delete the folder.
Move a folder:
-
In the table list, click the ellipsis associated with a folder item.
-
In the folder action menu, click Move
-
Click the location to where you want to move the folder.
NOTE: You cannot add folders to pivot tables.
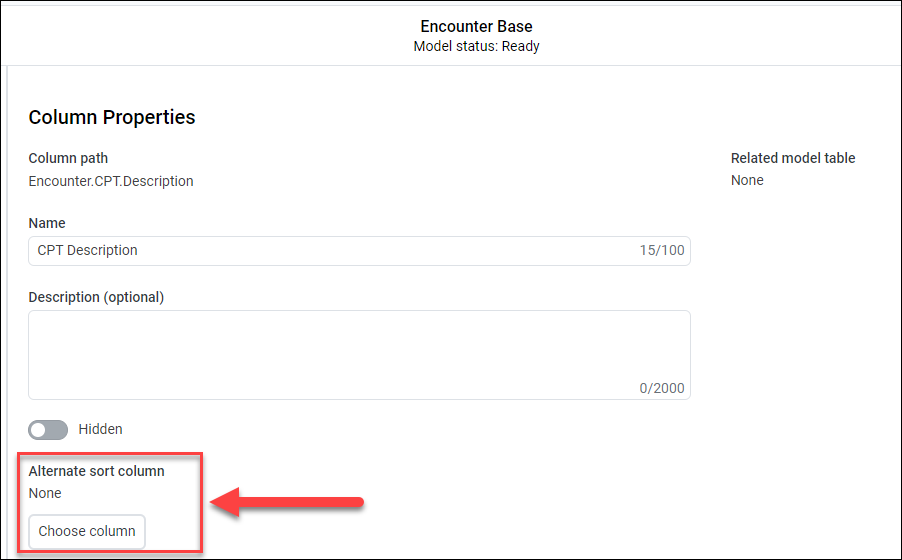
Changing the sort column
To display data in a column that is sorted by an alternative column, click Choose column in the Column Properties panel and select from a list of available sort columns.
If the column already uses an alternative sort, the Column Properties panel displays the alternative column and an option to Edit the alternative column.
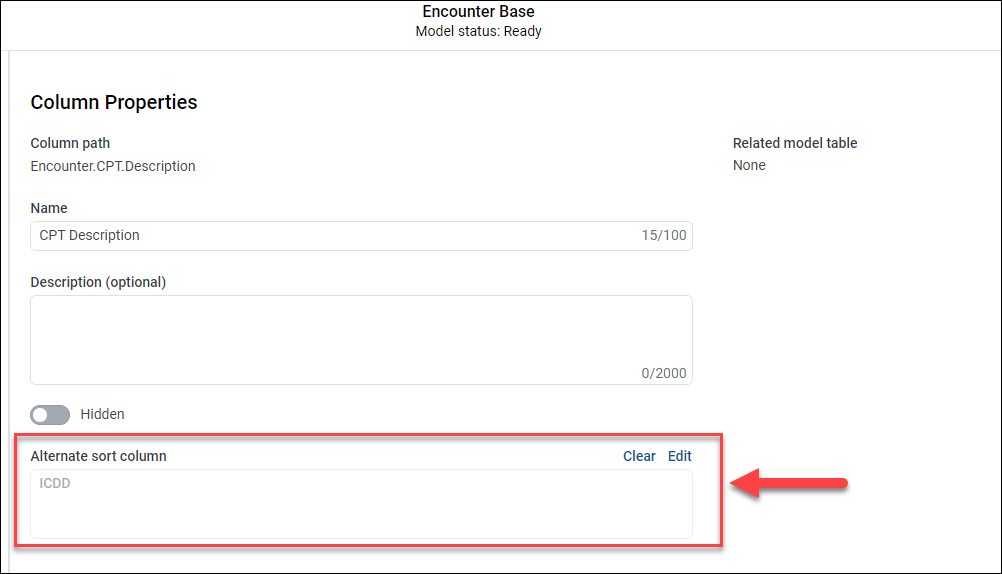
NOTE: The sort column you select must be present in the model.
